26 Dec 2023
The IDCA Digital Readiness Index Shows the Need for Steady Progress
(Fair warning: this article goes into the weeds a bit. I recommend some caffeine consumption before reading. I am happy to discuss everything discussed here at length for those of you who are interested in it.)
Economic development is a long, hard slog. Just as the world's problems were not created overnight, their solutions won't achieve a magical, overnight transformation, either.
This bit of clichéd observation is brought to you courtesy of me. You are welcome.
Tech Dreams vs. Reality
This observation's value, however, becomes apparent when contrasted against the persistent, endless glib optimism that's been brought to us courtesy of tech leaders for the past four decades. The Latest Great Thing or Shiny New Toy always promises to make its users wealthy and happy, and possibly smarter and better-looking.
If you're in the technology business (as I've been since the Reagan Administration), you've no doubt participated in a whopper or two about your company, its products and services, its new paradigm, its unique value proposition and competitive advantage, and its unmatched potential to dent the universe.
The IDCA Digital Readiness Index
Yet, in contrast, belief in the long, hard slog is not only held firmly within the minds of most people, it is embedded in the core data of IDCA Research's Digital Readiness Index of Nations. This Index examines 148 nations of the world with respect to their Economic progress (including digital infrastructure), Environmental sustainability, Social conditions, and Governance.
I began building the foundation of this research a decade ago, as I sought to create a way to measure technological and economic progress in developing nations in a relative way that cast them in a more fairminded way than traditional rankings, which inevitably (and merely) show wealthy nations on top and developing nations on the bottom. (I have a secondary goal of extinguishing the phrase, “this looks like a Third World nation,” which uses a term that is insulting, obtuse, and obsolete.)
Joining up with IDCA a year ago allowed the research to be kicked into a much higher gear. The IDCA Digital Readiness Index is stuffed with insights, ranging from clear-eyed evaluations of what each nation faces in its efforts to develop a Digital Economy, to correlations that can be linked to causation, arbitraging opportunities that reveal hidden under- and over- economic valuations, and insights that reveal some of the truly astonishing disparities that exist in the world.
From Natural Logs to 0-100
The results can be expressed on a 0-100 scale, with 100 being a utopian ideal. The 2023 index showed a world average of 46 and a world median of 47 (showing that no single nation or group of nations distorts the results), with nation scores ranging from 6 to 85.
The 0-100 scale is actually a mere construct that's meant to provide quick, intuitive access to the Index's findings. The actual results are open-ended, and best expressed on a natural logarithmic scale. It is here that the plain old difficulty of achieving substantial progress is revealed. A chart of all of the nation scores on a natural log creates this picture:
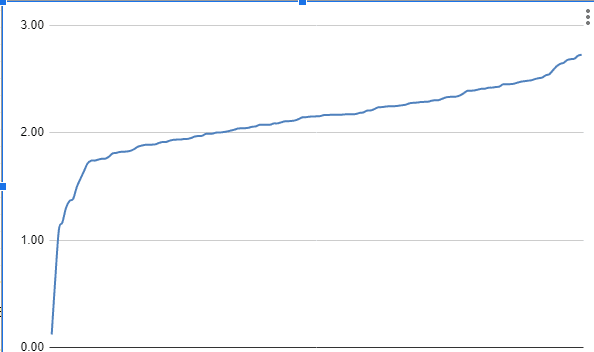
This shows scores ranging from the low of 6 on the 0-100 scale (expressed as 0.12 on the open-ended natural log scale) to the high of 85 (expressed as 2.73) cited above.
(Mathematicians, please note: you are correct, the natural logs here do not instantly convert to the 0-100 scale as I use it; as I integrate many types of both closed- and open-ended data from more than 100 sources into the final algorithm, I consulted Little Rudin, then did some Biles-worthy data acrobatics to get it to work properly. I'm always happy to discuss it.)
Anyway, we will notice a major inflection point right around 1.7, then another small inflection point near the top of the rankings. The first comes from the inclusion of a few severely troubled nations (eg Yemen, Eritrea, Haiti) in the rankings. The second comes from a slight distortion produced by a few, small Scandinavian nations in the top of the rankings that carry disproportionate weight within the data.
If we focus on the 140 or so nations that don't fall in either of the above categories, then the chart looks like this:
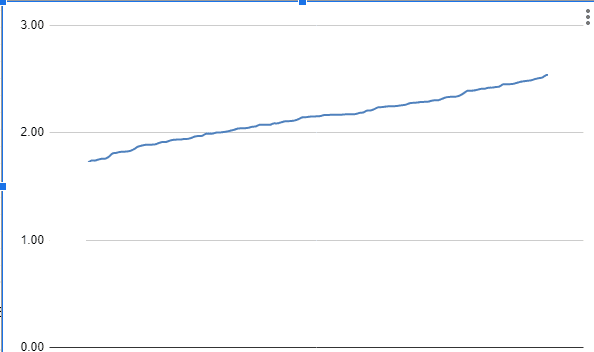
The “Aha” Moment Shows That Progress is Hard
This is where an “aha” moment may occur, because this chart shows that technology-driven socioeconomic progress (which the Digital Readiness Index ultimately measures) has been (and will be) achieved one slow, steady step at a time.
Examples of nations at the lower end of this chart include: Nigeria, Cameroon, Saudi Arabia, Bangladesh, Egypt, and Honduras.
Examples of nations in the median range include: China, India, Thailand, Oman, Ghana, Tunisia, and Morocco.
Examples of nations in the broad upper middle range include: the USA, Brazil, Greece, Romania, Poland, Ethiopia, Malaysia, and Rwanda.
Examples of nations at the upper end include: Chile, Costa Rica, Germany, the Netherlands, Slovenia, Lithuania, and the nation of Georgia.
Many of these names will seem surprising, and there is a much weaker correlation between wealth and these rankings than found in traditional ways of looking at things. Even this sample of about 30 nations does not do justice to the enormous detail behind the rankings of each individual nation, and the unique challenges that face each of them.
Broadly speaking, a lack of sustainable energy exacts a heavy penalty on nations, a perception of corruption is often an aerodynamic drag, and the amount of digital infrastructure a nation has developed compared to its per-person income is a major multiplier.
More Data About the World's Regions
The range here covers about 1 full point on the natural log scale, or about 2.7x. That is, the top nations have achieved roughly 2.7 times better progress than the bottom nations, regardless of their overall wealth. I like the natural log scale because I think it's a neat way to express diminishing returns; in this case, the more progress you make, the more difficult it will be to achieve future progress. Translating that 2.7x difference into what it means in the real world and creating actionable plans is the essence of developing a Digital Economy using this Index as a tool.
The difficulty can be seen in examining the data's regional averages. As noted above, the world average score is 46 on a scale of 0-100. By region, the scores are (with non-distorted ranges in parens):
* Africa – 44 (range from 32 to 62)
* Americas – 51 (range from 32 to 74)
* Asia – 46 (range from 35 to 67)
* Europe – 59 (range from 43 to 77)
* Middle East – 35 (range from 29 to 67)
These numbers show a considerable range among nations and regions while simultaneously illustrating the difficulty of progress – there are only 11 points of difference between the lowest African and European nations, and 15 points between the highest). Also, the Middle East region in general is punished by the amount of emissions associated with petroleum production and a lack of sustainable energy in the region.
As I say, a long, hard slog.
Not a Competition
All that said, this ranking is not meant to be a competition. There are no gold medals or blue ribbons to be handed out. Rather, the Index is meant to gauge where a nation stands, relatively speaking, what its key strengths are, what its greatest challenges are, and help define a pathway to progress.
Global investors of all types hold many trillions of dollars in search of safe havens, blue oceans, frontier markets, undervalued opportunities, diamonds in the rough, arbitrage, public-private partnerships, and myriad more conceivable ideas. The Digital Readiness Index can offer value to them, as well as to the governments and people who can benefit from continued progress.
Have a Glorious New Year, everyone, and I'm looking forward to working with any and all of you in 2024.
Follow us on social media:


.d57b427b.png&w=3840&q=75)